INSIGHT ARTICLE
How to track modal shift through annual CO2e emissions on the Mobilityways Dashboard
By Sarah Roberts, Head of Product at Mobilityways
Commuting emissions have steadily risen again as more organisations return to the office following the pandemic. Now, in order to show that sustainability and Scope 3 emissions targets are being met both internally and externally, the reporting of these figures has become more important than ever.
Since launch, over 50 sites across the UK have used Mobilityways to create an ACEL report, showing their Average Commuter Emissions Level for a particular year. As the only standardised methodology for calculating and comparing commuter emissions, ACEL helps employers to measure and manage their commuter emissions in line with their net-zero goals.
By creating these reports and discussing the data that they showcase, we have found that businesses and large organisations want to clearly see how much CO2 they are emitting and saving through commuting and working from home amongst their staff.
Mobilityways has now developed a standardised methodology of data collection so that all the different modes your employees use are calculated through CO2e, with the aim to give organisations a clear picture of how much CO2 they’re emitting and saving, and how they’re tracking against their targets. These reports can also show trends and predictions based on the data, too.

We have created reporting specifically for low frequency data – data that comes in periodically rather than regularly, like annual travel survey data collection.
The main benefits to this report are:
• You can track emissions per mode of transport
• You can track trends per mode of transport
• The report can give predictions on emissions for the future per mode of transport
• The report can outline the key areas where there is poor usage for certain modes of transport (e.g., low bus patronage).
Case Study
The chart below shows data from a business who has been collecting data on how their employees commute each year since 2016. It shows the emissions for each mode, extrapolated upwards across all their employees, to give them a clearer picture on the emissions created from their commuters.
This means that businesses who, for example, employ around 1000 people but usually get around 350 travel survey responses, will see those 350 responses extrapolated up to their headcount to show their emissions.
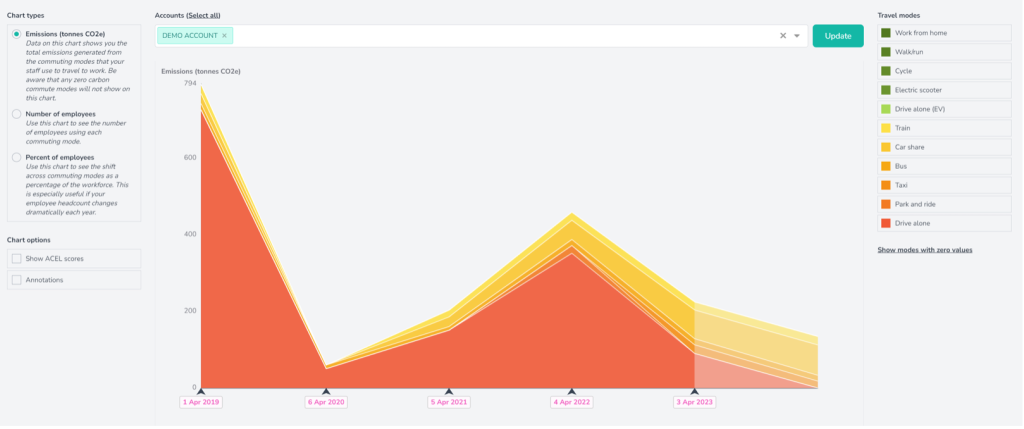
Figure 1: Emissions over a five-year period for a company of 1000 staff, per mode of transport.
The large red chunk in Figure 1 shows emissions from staff “driving alone”. You can see that this decreases over the years, and in turn decreases the overall level of emissions for that business. We can see the emissions lowered during the pandemic, but increased again when working from the office became the norm once more, albeit not returning to pre-pandemic levels.
Showcasing the percentage of staff using each mode of transport is equally important, especially as many Zero Carbon Commuting modes such as cycling or walking do not appear on the emissions chart (as they do not generate emissions). Figure 2 below shows the percentage of staff commuting with each mode over time:
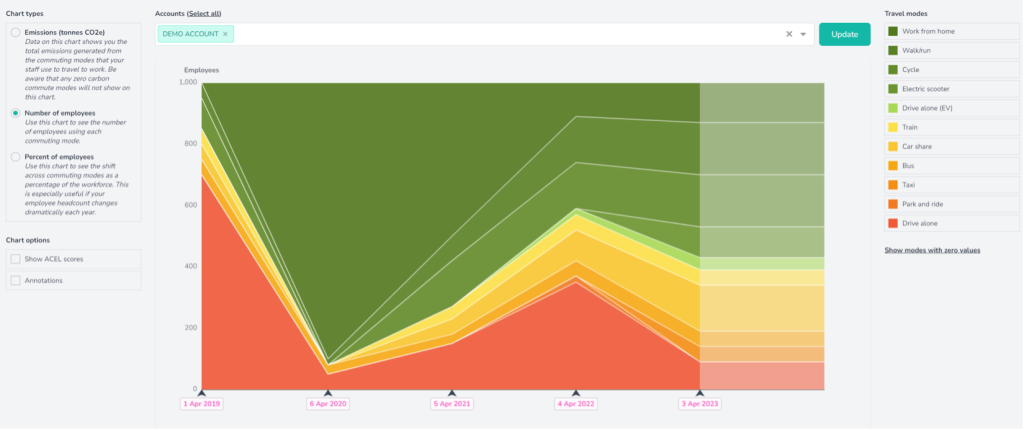
Figure 2: Number of employees using each mode of transport over a five-year period for a company of 1000 staff.
Percentage of employees per mode of transport is shown in Figure 3 below. This is important to track because, even though the number of employees may be increasing and your ‘driving alone’ figures may therefore increase, this may not necessarily be a bad thing. Even though your emissions could be rising overall, your average commuter emissions level could be going down – switching your look to show the percentage of employees using high-emissions travel will show this.
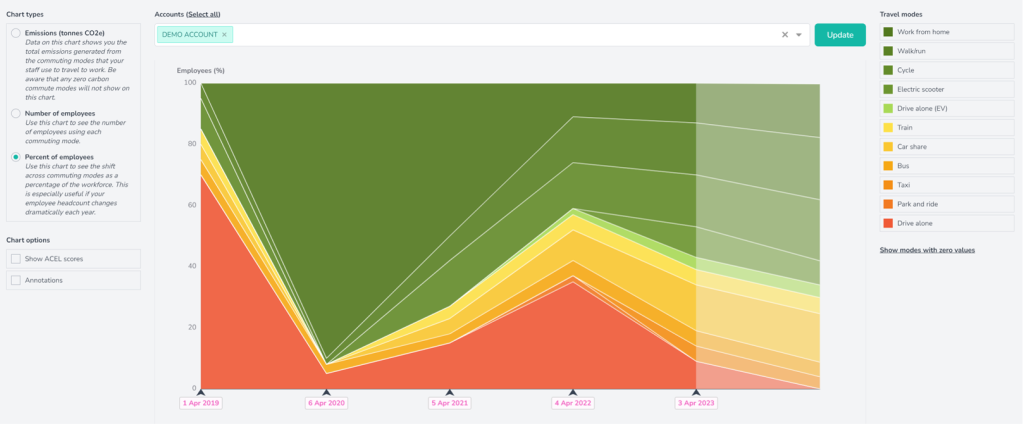
Figure 3: Percentage of employees using each mode of transport over a five-year period, for a company of 1000 staff.
You might also enjoy:
Data protection matters to consider when analysing commuter data
Book your demo of the Mobilityways platform
Start your Zero Carbon Commuting journey with a free consultation with one of our Commutologists
Get in touch now
Tell us a little more about your company, and we’ll call you back.